
Imagine buying a token at $10, watching it climb to $15, then panic selling when it drops back to $10... only to see it rocket to $30 the next week. This painful scenario plays out daily for traders who do not understand support and resistance zones, the invisible boundaries that govern price movement in crypto markets.
Support and resistance represent the foundation of technical analysis. These price levels act as psychological barriers where buying and selling pressure converge, creating predictable patterns that skilled traders exploit for profit. Whether you are trading Solana meme coins or established DeFi tokens, mastering these concepts transforms guessing into calculated decision-making.
In this comprehensive guide, you will learn how to identify, draw, and trade support and resistance zones like professional traders. From basic horizontal levels to advanced dynamic zones combining multiple timeframes, these techniques will sharpen your entry timing, improve your risk management, and boost your overall trading performance.
What Are Support and Resistance Zones?
Support and resistance zones represent price levels where market participants have historically shown willingness to buy or sell in significant quantities. These levels emerge from the collective psychology of thousands of traders making decisions based on past price action.
Understanding Support: The Price Floor
Support acts as a floor beneath price. When an asset falls to a support level, buying pressure typically emerges to prevent further decline. Think of support like a safety net: prices may touch it, even briefly pierce it, but buyers step in to push prices back up.
Support forms for several reasons:
Psychological round numbers attract buyers. Prices like $100, $50, or $10 serve as mental anchors where traders feel comfortable purchasing. These levels see increased order flow simply because humans prefer whole numbers.
Previous price lows create technical support. When price bounces from a level once, traders remember it. They place buy orders near that same level, expecting history to repeat. The more times price respects a level, the stronger that support becomes.
Institutional accumulation zones establish support. Large players cannot buy all at once without moving the market. They accumulate positions gradually at certain prices, creating invisible floors that hold when retested.
Moving averages often act as dynamic support. The 50-day and 200-day moving averages commonly serve as support during uptrends, with algorithms and technical traders placing buy orders when price touches these averages.
Understanding Resistance: The Price Ceiling
Resistance functions as a ceiling above price. When an asset rises to a resistance level, selling pressure emerges to cap further gains. Resistance represents the mirror image of support, formed by the same psychological and technical factors.
Resistance emerges from:
Previous price highs where sellers previously dominated. Traders who bought near these highs and suffered losses often sell when price returns, hoping to break even. This creates selling pressure at resistance.
Profit-taking by early buyers. When price reaches levels where earlier buyers enjoyed substantial gains, many choose to realize profits, creating temporary ceilings.
Short sellers entering positions. Traders betting on price declines often place sell orders at obvious resistance levels, adding to the selling pressure.
Psychological barriers like all-time highs. Breaking into uncharted territory requires extraordinary buying pressure because no traders exist who bought higher and are waiting to sell.
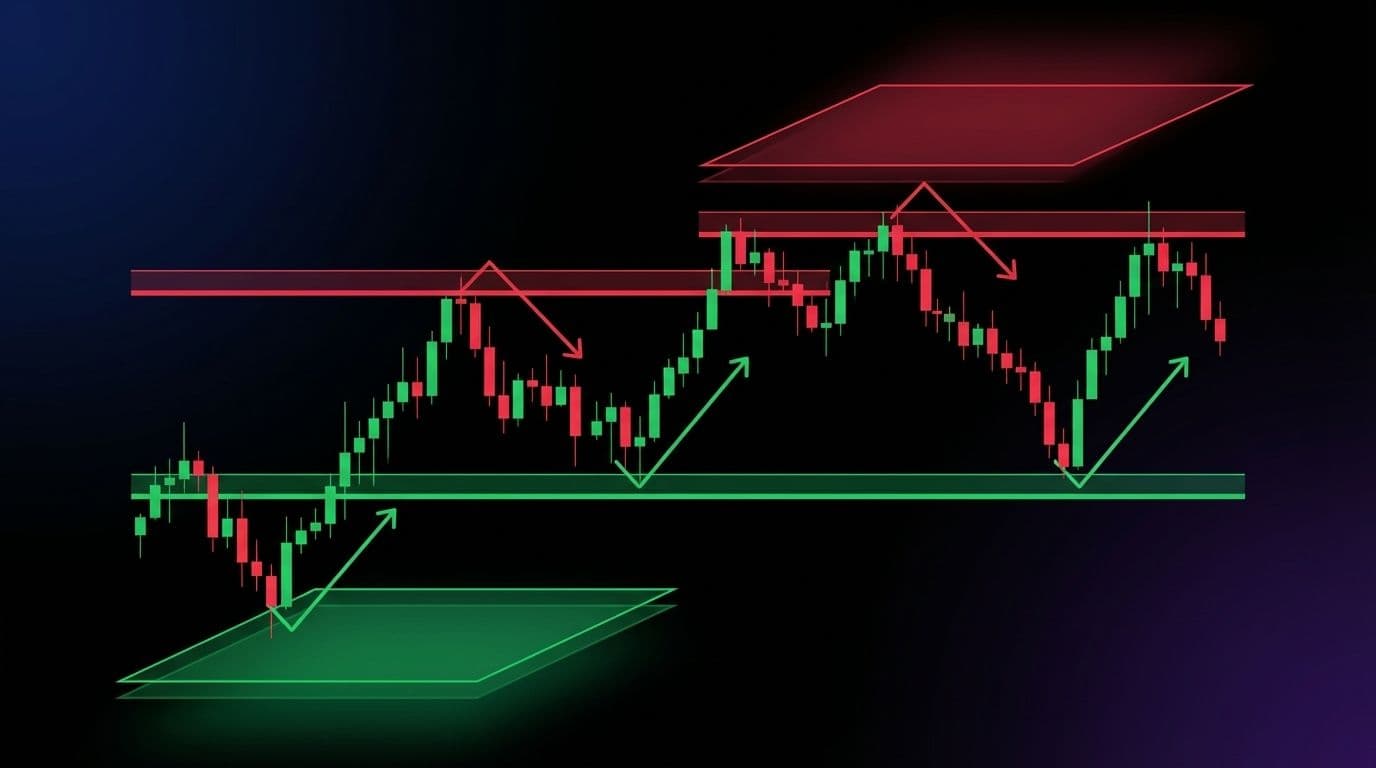
Why Zones Matter More Than Exact Lines
Novice traders draw support and resistance as single price lines. Professional traders recognize these as zones spanning several percentage points. Prices rarely reverse at exact levels; instead, they fluctuate within ranges where buying or selling pressure dominates.
A support zone might span $95 to $100 rather than exactly $100. Prices could dip to $97, $96, or even $94 before bouncing. The zone concept prevents premature entries and stops traders from placing orders at arbitrary single prices.
Zone width depends on several factors:
Higher timeframe levels create wider zones. Daily and weekly support zones span larger ranges than 15-minute zones because more traders participate across longer periods.
Volatility affects zone width. Highly volatile assets like low-cap Solana tokens require wider zones than stable large-caps like Bitcoin or Ethereum.
Historical testing frequency influences precision. Levels tested multiple times develop narrower, more reliable zones because the market has established clear consensus about fair value at those prices.
Types of Support and Resistance Levels
Not all support and resistance levels carry equal weight. Understanding the different types helps traders prioritize which levels deserve attention and which can be ignored.
Horizontal Support and Resistance
Horizontal levels represent the most basic and widely watched form of support and resistance. These flat lines across price charts mark specific prices where significant buying or selling occurred previously.
Identifying horizontal levels requires scanning price history for multiple touches. The more times price reversed at a level, the more significant that level becomes. Three or more touches establish strong horizontal support or resistance.
When drawing horizontal zones, look for:
Clear rejection wicks on candlesticks. Long lower wicks at similar prices indicate buying interest at those levels. Long upper wicks show selling pressure capping rallies.
Volume spikes at specific prices. Heavy volume during reversals confirms that many traders participated at those levels, making them more significant.
Round numbers that align with technical levels. When $100 coincides with a previous high, that level gains extra importance from both technical and psychological factors.
Recent price action takes precedence. Levels from the past month matter more than levels from two years ago, especially in fast-moving crypto markets.
Trendline Support and Resistance
Trendlines connect a series of higher lows in uptrends or lower highs in downtrends. Unlike horizontal levels, trendlines slope with the prevailing market direction, creating dynamic support and resistance that changes over time.
Drawing effective trendlines requires:
At least two touches to establish the line, though three or more provide greater reliability. The more times price respects a trendline, the stronger that trendline becomes.
Steep trendlines break easily. Trendlines rising or falling more than 45 degrees rarely hold for long because they require unsustainable price acceleration.
Log scale charts for crypto. Given the large percentage moves common in cryptocurrency, logarithmic price scales better capture trendline validity than linear scales.
Multiple timeframe confirmation. A trendline visible on both the 4-hour and daily charts carries more significance than one appearing only on a single timeframe.
Moving Average Support and Resistance
Moving averages smooth price data to reveal underlying trends while serving as dynamic support and resistance. Prices often bounce from major moving averages during healthy trends.
Key moving averages for crypto trading:
The 20-period moving average serves as support in strong short-term trends. Day traders watch this average closely for scalp entries.
The 50-period moving average indicates medium-term trend health. Price holding above the 50 MA suggests bullish conditions; breaks below signal potential trend changes.
The 200-period moving average defines long-term trends. This widely-followed average acts as major support during bull markets and resistance during bear markets.
Exponential moving averages react faster than simple moving averages. The EMA gives more weight to recent prices, making it more responsive for crypto's volatile movements.
Fibonacci Support and Resistance
Fibonacci retracement levels identify potential support and resistance based on mathematical ratios found throughout nature and financial markets. These levels predict where price might reverse after significant moves.
Key Fibonacci levels include:
The 38.2% retracement offers shallow pullback support during strong trends. Prices rarely reach this level in powerful moves, making it ideal for entries in trending markets.
The 50% retracement, while not a true Fibonacci number, marks the halfway point where buyers and sellers often reach equilibrium.
The 61.8% retracement represents the golden ratio and serves as maximum acceptable pullback in healthy trends. Breaking this level often signals trend weakness.
The 78.6% retracement acts as last-ditch support before full reversal. Bounces from this level can produce powerful trend continuations.
How to Draw Support and Resistance Zones Accurately
Precision in drawing support and resistance separates profitable traders from those who struggle. Follow these steps to mark levels that actually matter.
Step 1: Start with Higher Timeframes
Always begin analysis on higher timeframes before drilling down. Weekly and daily charts reveal the most significant levels that influence price action across all lower timeframes.
Higher timeframe levels act as magnets for price. Even if you trade on 15-minute charts, knowing where the daily support sits prevents fighting major trends.
Mark these higher timeframe levels first:
Major swing highs and lows from the past several months. These represent battlegrounds where significant buying and selling occurred.
All-time highs and lows. These psychological extremes often generate strong reactions when tested.
Consolidation areas where price moved sideways for extended periods. The edges of these ranges frequently become support or resistance.
Step 2: Identify Multiple Touch Points
Single touches do not create reliable support or resistance. Look for levels where price reversed at least two or three times, with each reversal showing clear rejection.
When marking zones, consider:
The bodies of candlesticks matter more than wicks. While long wicks show rejection, the body closes reveal where traders actually accepted price.
Volume during touches indicates level strength. High volume on reversals suggests many participants agree on the level's importance.
Recent touches carry more weight than ancient history. A level tested last week matters more than one tested six months ago.
Step 3: Create Zones Rather Than Lines
Extend your marks to encompass price fluctuations. A support zone might span $95-$100 rather than exactly $100, giving price room to breathe without triggering false signals.
Zone construction guidelines:
Use the bodies of reversal candles to define zone boundaries. The area between the lowest low and highest high of reversal candles forms your zone.
Extend zones slightly beyond obvious levels to account for stop hunting. Smart money often pushes price slightly beyond support to trigger retail stops before reversing.
Update zones as new price action develops. Fresh data might reveal that $97 matters more than $100, requiring zone adjustments.
Step 4: Remove Cluttered Levels
Too many support and resistance lines create analysis paralysis. Consolidate nearby levels into single zones and remove levels that price ignored recently.
Level prioritization rules:
Keep levels with three or more touches. Discard single-touch levels unless they coincide with major round numbers or moving averages.
Remove broken levels that price sliced through without reaction. These levels lost their significance and now distract from relevant zones.
Focus on levels near current price. Distant levels matter less than those price might test today or tomorrow.
Trading Strategies Using Support and Resistance
Identifying levels means nothing without executable strategies. These approaches translate support and resistance analysis into profitable trades.
Strategy 1: Bounce Trading
Bounce trading enters positions when price touches support in uptrends or resistance in downtrends, betting on continuation. This strategy offers excellent risk-reward ratios when executed correctly.
Entry triggers for bounce trades:
Wait for price to reach the support or resistance zone. Premature entries before price reaches zones increase risk.
Look for reversal candlestick patterns. Hammers, shooting stars, or engulfing patterns at zones confirm that price respects the level.
Confirm with volume divergence. Support bounces should show increasing volume; resistance rejections should show volume fading on failed breakout attempts.
Place entries after price clearly bounces. Buying the moment price touches support risks catching a falling knife if support breaks.
Set stop losses beyond the zone. If price pierces support decisively, the trade thesis fails, and you exit quickly.
Target the next significant level. In uptrends, aim for recent resistance. In downtrends, target previous support now turned resistance.
Strategy 2: Breakout Trading
Breakouts occur when price pierces support or resistance with conviction, signaling potential trend continuation or reversal. Breakout traders enter after confirmation, capturing momentum moves.
Valid breakout characteristics:
Strong volume accompanies the breakout. Weak volume breakouts often fail, returning to the zone they supposedly broke.
Price closes beyond the zone on the timeframe you trade. Intraday wicks beyond support do not count; wait for candle closes.
Retests of broken zones offer second chances. When support breaks, it often becomes resistance, providing better entry prices for shorts.
Multiple timeframe confirmation strengthens breakouts. A 15-minute breakout confirmed by a daily close beyond the level has higher success probability.
Entry and exit rules for breakouts:
Enter after the breakout candle closes beyond the zone. Aggressive traders enter immediately; conservative traders wait for retests.
Place stops on the opposite side of the broken zone. If long, stop goes below support that became support again after breakout.
Use measured moves for targets. The distance from the breakout point to the next major level often equals the move that preceded the consolidation.
Strategy 3: Range Trading
When price oscillates between clear support and resistance without breaking out, range traders buy support and sell resistance repeatedly until the range breaks.
Range trading guidelines:
Identify clear horizontal boundaries. Ranges require at least two touches of both support and resistance with rejections.
Measure the range width. Wider ranges offer better risk-reward; narrow ranges may not justify the trade after spreads and fees.
Trade toward the middle of the range, not the edges. Buying at support targets the range midpoint; selling at resistance targets the midpoint down.
Set tight stops for range trades. Because ranges eventually break, stops should be tighter than in trending strategies.
Take profits before the opposite boundary. Trying to squeeze every penny increases the chance of reversal hitting your position.
Exit immediately on breakout. When price breaks the range decisively, the range trading thesis fails regardless of current profit or loss.
Advanced Support and Resistance Concepts
Beyond basics, professional traders employ sophisticated techniques that increase precision and profitability.
Confluence Zones
Confluence occurs when multiple support or resistance factors align at similar prices. These overlapping levels create stronger zones than any single factor alone.
Examples of confluence:
Horizontal support aligns with the 200-day moving average. This combination of technical and psychological support creates powerful bounce potential.
Fibonacci retracement matches previous price highs. The 61.8% retracement landing exactly on a former resistance level creates formidable support.
Trendline support coincides with psychological round numbers. A rising trendline reaching $100 combines dynamic and static support.
Volume profile point of control aligns with visible chart support. When the price where most volume traded also matches technical support, that level gains significance.
Trading confluence zones:
Give confluence levels more weight in analysis. A trade based on triple confluence deserves larger position sizes than single-factor setups.
Expect stronger reactions from confluence. Bounces should be sharper; breakouts require more volume to succeed.
Use wider stops at confluence zones. Because these levels matter more, price might probe deeper before respecting the zone.
Support and Resistance Role Reversal
When support breaks decisively, it often becomes resistance. Conversely, broken resistance frequently becomes support. This role reversal principle drives many profitable strategies.
Understanding role reversal:
Previous buyers at support become sellers when that support breaks. They want to exit break-even when price returns to their entry.
Sellers who missed entries at resistance buy when price retests that level from above. They see the former ceiling as fair value.
Role reversal works best on major levels tested multiple times. Single-touch levels rarely produce clean role reversals.
Trading role reversals:
Wait for clear breaks before assuming reversal. False breaks waste capital and destroy confidence.
Enter on retests of broken levels. The highest-probability entries occur when price returns to a freshly broken support or resistance zone.
Use the role-reversed zone for stop placement. Long positions place stops below former resistance now serving as support.
Dynamic Support and Resistance with Indicators
Some indicators generate support and resistance levels that adapt as price evolves, offering tradeable levels in trending markets.
Bollinger Bands as dynamic support/resistance:
The middle band (20-period moving average) serves as support in uptrends and resistance in downtrends.
The upper band acts as resistance during strong uptrends. Touching the upper band often precedes pullbacks to the middle band.
The lower band provides support during strong downtrends. Bounces from the lower band target the middle band.
Ichimoku Cloud support and resistance:
The cloud itself represents future support or resistance. Price above the cloud sees support; price below encounters resistance.
The Tenkan-sen (conversion line) provides minor support/resistance in trending markets.
The Kijun-sen (base line) offers stronger dynamic support/resistance and often predicts future price movement.
Pivot points for intraday trading:
Daily pivot points calculate support and resistance levels based on previous day high, low, and close.
R1, R2, R3 represent resistance levels; S1, S2, S3 indicate support.
Price above the pivot suggests bullish bias; below suggests bearish bias.
Common Support and Resistance Mistakes
Even experienced traders make errors when applying support and resistance analysis. Avoiding these pitfalls improves consistency.
Drawing Too Many Levels
Chart clutter paralyzes decision-making. When every price point has a line, distinguishing meaningful levels becomes impossible.
Solutions:
Limit active levels to five or fewer per timeframe. Focus on the most significant, recently tested levels.
Delete levels that price ignored recently. If price sliced through a level without reaction, that level lost relevance.
Use different colors for major versus minor levels. This visual hierarchy helps prioritize which levels matter most.
Ignoring Timeframe Context
A support level on the 5-minute chart means nothing if the daily shows strong resistance just above. Timeframe alignment prevents fighting major trends.
Best practices:
Always check higher timeframes before trading lower timeframe levels. A 15-minute support level directly beneath daily resistance offers poor risk-reward.
Weight levels by timeframe significance. Weekly support outweighs hourly support when they conflict.
Use multiple timeframe analysis for confluence. When hourly and 4-hour support align, that zone carries more weight.
Trading Without Confirmation
Entering the moment price touches support risks catching falling knives. Many apparent bounces turn into breakdowns when buyers fail to materialize.
Confirmation strategies:
Wait for reversal candlestick patterns. Hammers, engulfing candles, or pin bars at support indicate buyer presence.
Require volume confirmation. Support bounces should show volume increasing as price rises.
Use RSI or stochastic divergence. When price makes lower lows but indicators make higher lows at support, reversal probability increases.
Enter on retests after initial bounces. Waiting for price to return to broken support-turned-resistance often provides safer entries.
Failing to Adjust Levels
Static support and resistance lines become outdated as markets evolve. Levels that mattered last month might mean nothing today.
Adjustment guidelines:
Review levels weekly and remove irrelevant ones. Markets change; your analysis should too.
Add new levels as fresh price action develops. Recent swing highs and lows deserve immediate attention.
Widen zones in volatile markets and tighten them during consolidation. Volatility affects how precisely price respects levels.
Combining Support and Resistance with Onchain Analytics
While technical traders use price charts, onchain analysts examine blockchain data. Combining both approaches creates powerful trading edges.
Exchange Flows and Support/Resistance
Exchange inflows and outflows reveal whether whales accumulate or distribute at support and resistance levels.
Bullish confluence signals:
Price tests major support while exchange outflows spike. Large holders withdrawing coins to cold storage while price sits at support suggests accumulation.
Whale wallets increase holdings as price touches support. Smart money buying while retail panics creates strong bounce potential.
Exchange reserves drop during support tests. Declining supply available for sale makes support more likely to hold.
Bearish warning signs:
Exchange inflows surge as price approaches resistance. Whales depositing coins to sell at resistance increases breakout failure probability.
Large holders reduce positions near resistance. Distribution by smart money while retail chases breakouts signals caution.
Exchange reserves rise during resistance tests. Increasing available supply makes resistance more likely to hold.
Tools like Solyzer track these onchain metrics in real-time, alerting traders when whale behavior aligns with technical levels. Combining exchange flow analysis with support and resistance zones significantly improves trade timing.
Holder Distribution at Key Levels
Analyzing who holds tokens at specific prices reveals support and resistance strength.
Strong support indicators:
Long-term holders dominate the price zone. Investors who held through volatility show conviction that supports prices.
Concentrated accumulation occurred at the level. Large purchases by multiple wallets at similar prices create strong demand zones.
Loss-making holders refuse to sell. Onchain data showing holders underwater but not selling indicates strong hands supporting the level.
Weak support warnings:
Short-term speculators hold most positions. Traders seeking quick profits lack conviction to hold through dips.
Concentrated selling pressure exists just below support. Large sell orders by underwater holders waiting to break even threaten support.
High concentration of leverage near the level. Liquidation cascades trigger when price approaches leveraged positions, accelerating breakdowns.
Realized Price as Dynamic Support
Realized price represents the average price at which all tokens last moved. This onchain metric often serves as powerful support during corrections.
Trading with realized price:
Price above realized price indicates profitable market. The realized price acts as support during healthy bull markets.
Price below realized price signals capitulation risk. Sustained trading below realized price often precedes prolonged bear markets.
Short-term holder realized price provides shorter-term support. This metric reacts faster to recent price action than long-term measures.
Combining realized price with chart support creates confluence zones of exceptional strength. When horizontal support aligns with realized price, that zone deserves maximum attention.
Risk Management with Support and Resistance
Even the best support and resistance analysis fails without proper risk management. Structure trades to survive inevitable wrong calls.
Position Sizing Based on Zone Width
Wider zones accommodate larger positions; narrow zones require smaller exposure. Adjust sizing based on the distance between entry and stop loss.
Sizing formula:
Risk 1-2% of account per trade maximum. This ensures a string of losses cannot destroy the account.
Calculate position size using: Risk Amount divided by (Entry Price minus Stop Loss Price).
Wider zones allow larger positions because stops sit further away, maintaining the same dollar risk.
Narrow zones require smaller positions to keep risk constant when stops must be tight.
Stop Loss Placement Beyond Zones
Stops belong beyond support and resistance zones, not within them. Placing stops too close guarantees stop-outs from normal price fluctuations.
Stop placement guidelines:
For long positions, place stops below the support zone, not within it. Give price room to test support without stopping you out.
Use Average True Range (ATR) to set buffer distances. Stops at 1.5-2x ATR beyond support accommodate normal volatility.
Adjust stops as new support forms. When price establishes higher lows, move stops to protect profits while maintaining cushion.
Never move stops further away after entry. Widening stops to avoid losses destroys risk management discipline.
Taking Partial Profits at Resistance
Rather than exiting entirely at resistance, take partial profits and let remainder run. This captures value while maintaining upside exposure.
Partial profit strategy:
Sell 50% of position at first resistance target. This recovers initial risk while leaving profit potential.
Move stop to breakeven on remaining position. Now the trade risks nothing while offering further gains.
Sell another 25% at second resistance level. Continue scaling out as price reaches subsequent targets.
Let final 25% run with trailing stop. This captures extended moves when resistance breaks decisively.
Conclusion: Mastering Support and Resistance for Consistent Profits
Support and resistance zones form the backbone of successful crypto trading. These invisible boundaries reveal where markets pause, reverse, or accelerate, giving prepared traders predictable opportunities.
Mastering these concepts requires practice. Start by marking obvious horizontal levels on higher timeframes. Gradually incorporate trendlines, moving averages, and Fibonacci tools. Eventually, combine technical analysis with onchain metrics for comprehensive market understanding.
Remember that no level works perfectly every time. Support breaks; resistance shatters. The goal is not perfect prediction but favorable probabilities. When support holds six times out of ten, proper risk management ensures profitability from those odds.
Ready to apply these techniques to live markets? Solyzer provides the onchain analytics you need to confirm support and resistance levels with real blockchain data. Track exchange flows, monitor whale movements, and identify accumulation zones alongside your technical analysis.
Whether you trade Solana tokens or diversify across multiple chains, combining chart-based support and resistance with onchain intelligence creates the complete trading toolkit. Visit Solyzer today to access professional-grade analytics that elevate your support and resistance trading to the next level.
The markets await. Your zones are drawn. Now execute with discipline.