
How to Use Stochastic Oscillator for Crypto Swing Trading
The cryptocurrency market never sleeps. With 24/7 trading and extreme volatility, finding reliable tools to time your entries and exits becomes essential for any serious trader. Among the dozens of technical indicators available, the Stochastic Oscillator stands out as one of the most powerful yet misunderstood tools for crypto swing trading.
Whether you are trading Bitcoin at $71,000, Ethereum at $2,191, or the latest Solana DeFi token at $90, understanding how to read and apply the Stochastic Oscillator can transform your trading results. This comprehensive guide will walk you through everything you need to know about using this momentum indicator to identify high-probability swing trade setups in the crypto markets.
What Is the Stochastic Oscillator?
The Stochastic Oscillator is a momentum indicator developed by George Lane in the late 1950s. Unlike trend-following indicators that lag behind price action, the Stochastic Oscillator predicts potential reversals by comparing a cryptocurrency's closing price to its price range over a specific period.
The indicator operates on a simple but powerful premise: during uptrends, prices tend to close near their highs, while during downtrends, prices tend to close near their lows. When this pattern breaks, it often signals a potential reversal.
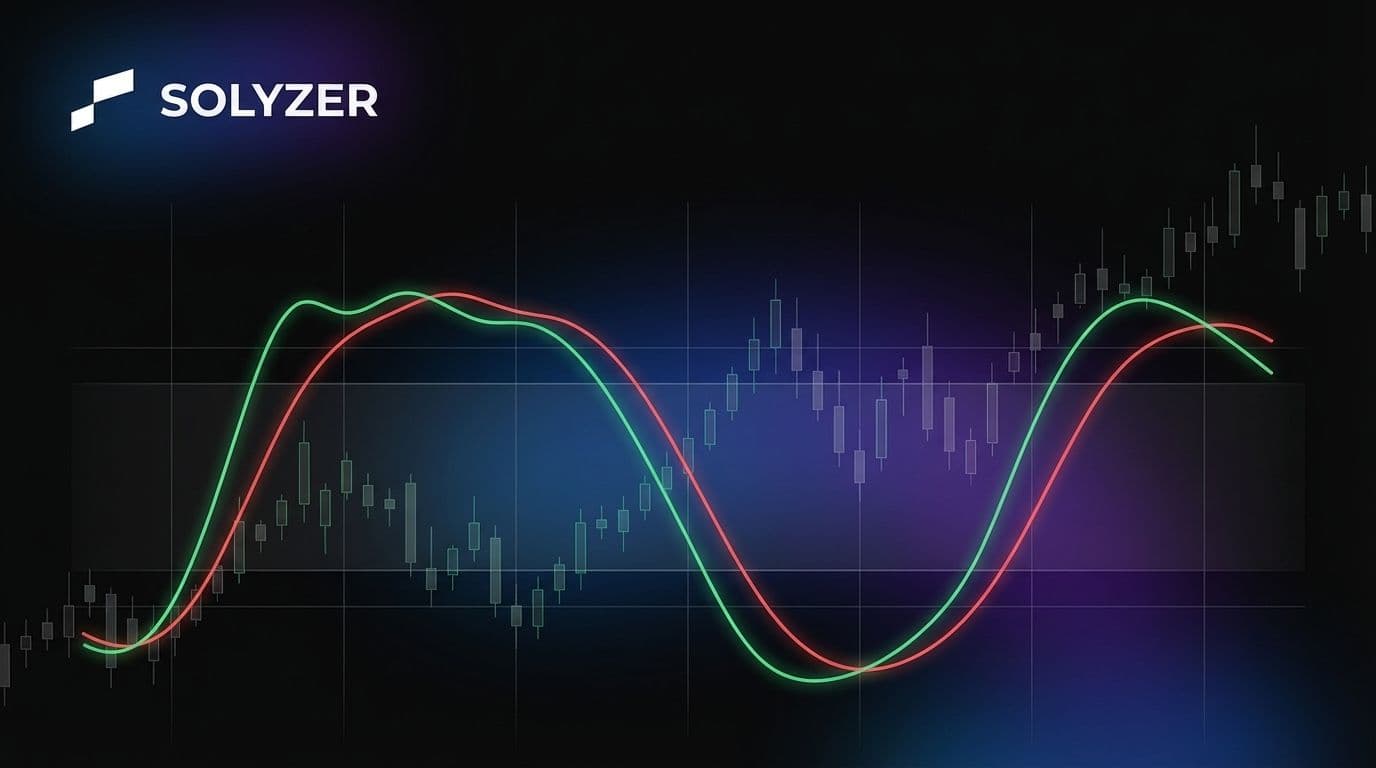
The Stochastic Oscillator consists of two lines:
- %K Line (Fast Stochastic): The main line that reflects the current price position relative to the high-low range
- %D Line (Slow Stochastic): A moving average of the %K line that acts as a signal line
The Formula Explained
The basic Stochastic Oscillator formula is:
%K = [(Current Close - Lowest Low) / (Highest High - Lowest Low)] × 100Where:
- Lowest Low: The lowest price over the lookback period (typically 14 periods)
- Highest High: The highest price over the lookback period
- Current Close: The most recent closing price
The %D line is calculated as a 3-period simple moving average of %K.
Why the Stochastic Oscillator Works Well for Crypto
Cryptocurrency markets have unique characteristics that make the Stochastic Oscillator particularly effective:
High Volatility Creates Clear Signals
Crypto assets experience price swings that would be considered extreme in traditional markets. Bitcoin's 4.35% daily move and Solana's 5.12% swing are common occurrences that generate pronounced overbought and oversold conditions, making Stochastic signals more reliable than in less volatile markets.
24/7 Trading Means More Data Points
Unlike stocks that only trade during market hours, cryptocurrencies trade continuously. This constant price action provides more frequent Stochastic readings and faster signal generation for swing traders. With the current market showing bullish momentum across major assets, traders need tools that can keep up with rapid price movements.
Retail-Driven Markets Show Clear Psychology
The Stochastic Oscillator excels at measuring market psychology, and crypto markets remain heavily influenced by retail sentiment. The recent rebound in Crypto Fear and Greed index from extreme lows demonstrates how quickly sentiment can shift, creating predictable Stochastic patterns that smart traders can exploit.
How to Read Stochastic Oscillator Signals
Understanding what the Stochastic Oscillator is telling you requires interpreting its position and movement within the 0-100 range.
Overbought and Oversold Levels
The Stochastic Oscillator uses two key threshold levels:
- Above 80: Indicates overbought conditions. The cryptocurrency may be due for a pullback or reversal.
- Below 20: Indicates oversold conditions. The cryptocurrency may be due for a bounce or reversal.
Important note for crypto traders: Because of the market's tendency toward strong trends, assets can remain overbought or oversold for extended periods. Never trade based solely on these levels without additional confirmation.
Bullish and Bearish Crossovers
The most common Stochastic trading signals come from crossovers between the %K and %D lines:
Bullish Crossover: Occurs when the %K line crosses above the %D line in the oversold territory (below 20). This suggests potential upward momentum and a buying opportunity.
Bearish Crossover: Occurs when the %K line crosses below the %D line in the overbought territory (above 80). This suggests potential downward momentum and a selling or shorting opportunity.
Divergence Signals
Divergence between price and the Stochastic Oscillator often precedes significant reversals:
Bullish Divergence: Price makes a lower low while the Stochastic makes a higher low. This signals weakening selling pressure and a potential upward reversal.
Bearish Divergence: Price makes a higher high while the Stochastic makes a lower high. This signals weakening buying pressure and a potential downward reversal.
Stochastic Oscillator Settings for Crypto Swing Trading
The default Stochastic settings (14, 3, 3) work well for many markets, but crypto traders often benefit from adjustments based on their trading timeframe and the specific asset's volatility.
Recommended Settings by Timeframe
4-Hour Charts (Medium-Term Swings):
- Period: 14
- %K Smoothing: 3
- %D Smoothing: 3
Daily Charts (Longer Swings):
- Period: 14
- %K Smoothing: 3
- %D Smoothing: 3
1-Hour Charts (Shorter Swings):
- Period: 21
- %K Smoothing: 7
- %D Smoothing: 7
The increased smoothing on lower timeframes helps filter out crypto market noise while maintaining signal responsiveness.
Fast vs. Slow Stochastic
Fast Stochastic (14, 3): More sensitive to price changes, generates more signals but with more false positives. Best for volatile altcoins.
Slow Stochastic (14, 3, 3): Smoother line movement, fewer signals but higher quality. Better for major cryptocurrencies like Bitcoin and Ethereum.
Full Stochastic: Allows customization of all parameters. Experienced traders often use settings like (21, 7, 7) for crypto swing trading.
Practical Stochastic Trading Strategies for Crypto
Now that you understand the mechanics, let us explore specific strategies you can implement immediately.
Strategy 1: The Classic Swing Trade Setup
This strategy combines Stochastic signals with trend analysis for high-probability entries.
Entry Rules for Longs:
- Identify an uptrend using a 50-period moving average or higher timeframe analysis
- Wait for price to pull back into the oversold zone (Stochastic below 20)
- Enter when %K crosses above %D with confirmation candle
- Place stop loss below the recent swing low
Entry Rules for Shorts:
- Identify a downtrend using a 50-period moving average or higher timeframe analysis
- Wait for price to rally into the overbought zone (Stochastic above 80)
- Enter when %K crosses below %D with confirmation candle
- Place stop loss above the recent swing high
Real Example: In March 2026, Solana (SOL) experienced a pullback to $85 after rallying to $95. The Stochastic Oscillator on the 4-hour chart dropped below 20, and a bullish crossover occurred at $87. Traders who entered on this signal captured a move back above $95 within 48 hours, riding the current bullish momentum that has pushed SOL to $90.
Strategy 2: Divergence Trading
Divergence signals often provide the highest-probability setups in crypto markets.
Bullish Divergence Setup:
- Price makes a lower low on the chart
- Stochastic Oscillator makes a higher low
- Wait for bullish crossover in oversold territory
- Enter long position with stop below the most recent low
Bearish Divergence Setup:
- Price makes a higher high on the chart
- Stochastic Oscillator makes a lower high
- Wait for bearish crossover in overbought territory
- Enter short position with stop above the most recent high
Why It Works: Divergence indicates that momentum is shifting before price reflects the change. In crypto, where sentiment can shift rapidly, catching these early signals provides a significant edge. Professional traders using platforms like Solyzer can track these divergence patterns across multiple timeframes to confirm signals before entering positions.
Strategy 3: Stochastic in Ranging Markets
Cryptocurrencies frequently enter consolidation phases after strong moves. The Stochastic Oscillator excels in ranging markets where price oscillates between support and resistance levels.
Range Trading Rules:
- Identify clear support and resistance levels on your chart
- Wait for Stochastic to reach oversold (below 20) near support
- Enter long when %K crosses above %D
- Take profits near resistance or when Stochastic reaches overbought
- Reverse the process for short trades near resistance
Risk Management: Range trading requires tight stops because breakouts can be violent. Place stops just outside the range boundaries to protect against false breakouts.
Strategy 4: Multi-Timeframe Confirmation
Professional crypto traders rarely rely on a single timeframe. Using multiple timeframes provides confirmation and filters out false signals.
The Triple Screen Approach:
- Higher Timeframe (Daily or 12H): Determine the overall trend direction. Only take trades in the direction of the higher timeframe trend.
- Intermediate Timeframe (4H): Look for Stochastic signals that align with the higher timeframe trend.
- Lower Timeframe (1H): Use for precise entry timing. Enter when the 1H Stochastic confirms the 4H signal.
Example: If the daily chart shows an uptrend with Stochastic pulling back to oversold levels, wait for the 4-hour chart to show a bullish crossover, then use the 1-hour chart to time your exact entry.
Common Mistakes When Using Stochastic in Crypto
Even experienced traders make mistakes when using the Stochastic Oscillator. Here are the most common pitfalls to avoid:
Trading Against the Trend
The Stochastic Oscillator is a momentum indicator, not a trend indicator. Taking short positions when the Stochastic reaches overbought in a strong uptrend, or long positions when it reaches oversold in a strong downtrend, leads to consistent losses.
Solution: Always check the higher timeframe trend before taking Stochastic signals. Use a 50-period or 200-period moving average to determine trend direction.
Ignoring Market Context
Stochastic signals that occur during major news events or market-wide selloffs are less reliable. The indicator can remain oversold for extended periods during crashes or overbought during parabolic rallies.
Solution: Check the economic calendar and crypto news before entering positions. The recent Fed rate decisions and geopolitical events have shown how external factors can override technical signals.
Over-Optimizing Settings
Constantly changing Stochastic settings to fit past price action leads to curve-fitting. What worked perfectly for last week's Bitcoin trades may fail completely this week.
Solution: Stick to proven settings (14, 3, 3) or (21, 7, 7) and focus on proper risk management rather than perfect entries.
Neglecting Volume Confirmation
Stochastic signals without volume confirmation are less reliable. A bullish crossover on low volume may indicate weak buying pressure rather than a genuine reversal.
Solution: Use volume indicators alongside Stochastic. Look for increasing volume on breakout candles to confirm Stochastic signals.
Combining Stochastic with Other Indicators
The Stochastic Oscillator works best when combined with other technical tools. Here are effective combinations for crypto trading:
Stochastic + Moving Averages
Use moving averages to define trend direction and Stochastic for entry timing. When price is above the 50-period MA and Stochastic gives a bullish crossover in oversold territory, you have a high-probability long setup.
Stochastic + RSI
The Relative Strength Index (RSI) and Stochastic are both momentum oscillators, but they calculate momentum differently. When both show oversold conditions simultaneously, the reversal probability increases significantly.
Stochastic + Support/Resistance Levels
Stochastic signals that occur at key support or resistance levels are more reliable than signals in the middle of a trading range. Look for confluence between Stochastic readings and horizontal support/resistance zones.
Stochastic + Volume Profile
Volume Profile shows where most trading activity has occurred. Stochastic signals near the Point of Control (POC) or Value Area High/Low provide excellent risk-reward setups.
Risk Management for Stochastic-Based Trading
No indicator is perfect, and the Stochastic Oscillator will generate false signals. Proper risk management is essential for long-term profitability.
Position Sizing
Never risk more than 1-2% of your trading capital on a single trade. Even the best Stochastic setups can fail, and preserving capital allows you to survive losing streaks.
Stop Loss Placement
Place stops based on technical levels rather than arbitrary percentages. For long positions, place stops below recent swing lows or support levels. For short positions, place stops above recent swing highs or resistance levels.
Take Profit Strategies
Consider these exit strategies for Stochastic trades:
- Fixed Targets: Take profits at predetermined risk-reward ratios (1:2 or 1:3)
- Trailing Stops: Move stops to breakeven once price moves in your favor, then trail below swing lows
- Opposite Signal: Exit when Stochastic reaches the opposite extreme (overbought for longs, oversold for shorts)
Real-World Application: Current Market Analysis
As of March 2026, the crypto market presents several Stochastic opportunities. Bitcoin trading around $71,000 has shown consolidation after the recent Fed rate decision, creating range-bound conditions perfect for Stochastic trading.
Solana at $90 has demonstrated strong momentum with periodic pullbacks to the 4-hour Stochastic oversold zone, providing entry opportunities for swing traders. The current Fear and Greed index reading suggests cautious optimism, supporting a strategy of buying oversold bounces rather than chasing overbought rallies.
Ethereum at $2,191 has maintained correlation with Bitcoin while showing independent strength in DeFi sectors. Traders can use Stochastic divergences on ETH/BTC pairs to identify when Ethereum is likely to outperform or underperform the broader market.
Conclusion: Mastering the Stochastic Oscillator
The Stochastic Oscillator remains one of the most valuable tools for crypto swing traders when used correctly. Its ability to identify momentum shifts before they appear in price action gives traders a crucial edge in volatile markets.
Success with Stochastic trading requires patience, discipline, and proper risk management. Focus on high-probability setups that align with the trend, confirm signals across multiple timeframes, and always protect your capital with appropriate stop losses.
Ready to put these strategies into practice? Start tracking Stochastic signals on your favorite cryptocurrencies with Solyzer, the comprehensive Solana analytics platform that helps traders identify momentum shifts, track whale movements, and make data-driven trading